In a previous post I introduced Hazelcast as an effective tool supporting modern distributed computing needs. In this post, the goal is to provide the reader with some figures about Hazelcast’s performances. The ‘writes-perspective’ is chosen, a MicroBenchmark was carried out with the aim to assess Hazelcast’s delivery capabilities in a write-intensive scenario: operation latency in such scenario is particularly critical as one can imagine.
Let’s start with the benchmark settings. I made use of my own benchmark tool, that can be find on my GitHub, it’s named DOBEF: the code is there. Mine was a Linux box (Fedora 20 x64, 3.11.x) equipped with 4GB of RAM, 4 CPUs and SSD.
- 1 Hazelcast Instance shared among Producers.
- 10 Producers writing 10K randomly generated data samples on the same Map.
The experiment is repeated 10 times to balance the measurement noise, and a dedicated warm-up phase is accomplished before to consider any timing.
Metrics of interest were i. Elapsed, ii. 95th Percentile Time, iii. Throughput and iv. Expected Latency. Hereafter, a serie of graphs shows these metrics elaborated from the benchmark results.

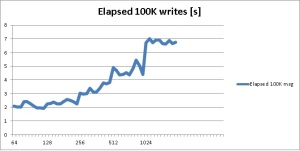
According to the Elapsed graph, Hazelcast is able to manage a bulk of 100K concurrent writes in around 7 seconds, when the data samples size is 1024 bytes. This is a pretty interesting result, seen the very stressful scenario: concurrent writes like those ones, create a very high level of contention on the target data structure, and this effect is amplified for distributed data structures like the Hazelcast’s ones.

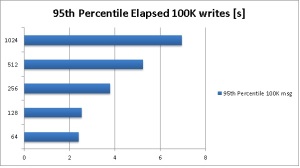
The 95th Percentile analysis results, confirms us a good measurement campaign since the samples are well represented by their average.

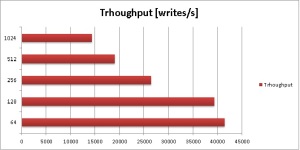
The Throughput is very interesting. For small chunks of data, Hazelcast is really fast: around 40K writes per second can be concurrently accomplished. On the other hand, relatively big chunks of data show falling performances: only around 15K writes per second can be sustained. All in all, the throughput is still encouraging.

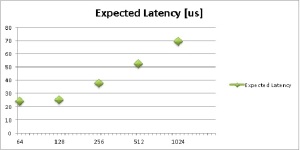
From the above throughput results, the expected latency can be retrieved. Again, interesting figures show us how good is the Hazelcast’s response time: for small chunks of data, in such stressful scenario (bulk writing on the same Map), Hazelcast serves the requests in less than 30 us (i.e. microseconds); the behavior, as expected, is almost linear and so for relatively big chunks of data, a write request is served in around 70 us.
For the interested reader, on YouTube an interesting webinar explains how to tune the Hazelcast’s serialization to achieve better performances.
In conclusion, after having introduced Hazelcast and its features, in this post a pretty formal assessment of its performances has been done. Interesting figures have been extracted from the presented metrics, in particular tens of microsends latency in high-contented write scenario represents something to seriously take into consideration for high-performance computing systems. For the sake of completeness, I’ll reproduce the benchmark on a distributed bench with the aim to double check the obtained results.


Hey,
as it seems to me you’re running Hazelcast on a single node which is not the expected usecase. It is nice to see the results but eventually this benchmark is useless since you’re not using it in a normal usecase.
Possbibly by adding more nodes the performance might drop a bit (due to overhead on the cluster and backups) but you would show a more realistic usage.
Chris
LikeLike
Hey Chris,
thanks to following.
I was implementing a Micro Benchmark aiming at stressing Hazelcast and its Data Structures: under high write-contention I was investigating Hazelcast’s implementation and its performances. In my opinion, the test scenario is coherent with the benchmark goal.
I’ll try to add more nodes repeating the tests to provide a more comprehensive configuration, i.e. distributed clustering.
Thanks again for your feedback.
Cheers,
P
LikeLike
Reblogged this on nothing special.
LikeLike